America’s Genocide Against Black People: Pandemic Edition

The coronavirus pandemic is a worldwide catastrophe that, as of this writing, is still developing in ways most of which are impossible to predict.  However, we can begin to anticipate…

The coronavirus pandemic is a worldwide catastrophe that, as of this writing, is still developing in ways most of which are impossible to predict.  However, we can begin to anticipate some its effects on one particularly vulnerable population: the descendants of enslaved Africans in the United States.

Myths, especially when ideologically useful, are tenacious.  The myth of universal American prosperity is one of those. But in truth, American prosperity, even in normal times, is made inaccessible for a large part of the population by the nation’s White Supremacist framework. As a consequence it is conventional in international comparative socio-economic studies to treat the United States as two countries, one highly developed, to be compared with OECD states such as those in the European Union, the other ranking with less developed countries.  No prizes for realizing that the latter is inhabited by African-Americans, who, by every relevant measure, live in another country, as it were, from their more prosperous White fellow citizens.

The U.S. Census numbers tell the story: in 2018 13 percent of all people (and the same percentage of White people), lived at or below the poverty line of $26,200 for a family of four, while nearly twice that percentage, 23 percent of African-Americans lived in poverty. If we count households, rather than individuals, 17 percent of White households have incomes below the poverty line, compared, again, to nearly twice that percentage, in this case 32 percent of Black households. 

Life below the poverty level, and life for those with incomes approaching it, is in normal times differentiated from the life of the American Dream by the all too concrete reality of little food, inadequate access to good quality education, bad health and shorter lives.  For many Black Americans those are the factors of day to day reality. But these are not normal times. 

In these plague days, many Black Americans will be even less likely to have adequate access to food, their children will be less likely to have access to adequate educational resources, and will therefore as adults lack the necessary qualifications for middle class employment.  In the long run this will result in even lower near-term and life-time incomes with all that implies in poor health and  shorter lives, for individuals, for their children, and for Black America. A crucial matter here is potential pandemic learning loss and its implications for Black school children, especially those living in high poverty or near poverty households.

As the conclusion reached by this blog will be disturbing and probably controversial, it would be best to work toward it carefully, step by step, at each step comparing the situation of Black Americans, children and adults, to that of White Americans, as it is the inequities that journey will reveal that are, in a sense, both resultant and causal.

James Thomas helps his son Jamal Lee Jr., 10, re-create a lung with a balloon and plastic bottle during an online science class at their San Leandro home as his other son, Javaughn Thomas, 7, watches.
For Black families such as that of James Thomas, the pandemic is now forcing them to come up with ways to augment what is being lost because school buildings are closed. [Photo courtesy of Gabrielle Lurie, San Francisco Chronicle.]

As we have just seen, Black families are more likely to be poor than White families. There are poor White families, of course, but the percentage of poor Black families is routinely much higher than the percentage of poor White families. Median incomes in 2018 were $65,900 for White households, $41,500 for Black households—Black families on average live on less than two-thirds of the incomes of White families and two-thirds of Black households have incomes below the median for White households. Even in good times, before the financial crisis and then again just before the pandemic, twice the percentage of Black households as the general population lived in poverty. This extends to their children in an even more severe fashion. Before the pandemic, approximately 15 percent of White children under age 18 lived in households with incomes below the poverty line. That percentage for Black children was 35 percent, or more than one in three.

Black families are likely to be poor; Black children are very likely to live in poor households; schools attended predominantly by Black children are likely to be poorly resourced.  Racial inequities in education—that pre-existing condition—are apparent in the acquisition of basic skills.  In 2019, before the pandemic, at the crucial middle school grade eight, 81 percent of White, non-Hispanic, students scored at or above the Basic level on the National Assessment of Educational Progress’ reading test; however, only 54 percent of Black students did so.  Or, to put it another way, just 19 percent of White students, but 46 percent – nearly half – of Black students read below the Basic level in eighth grade. They could not easily read. That is the racial divide—not the cause, but the result of inequality of resources and opportunities.

Household income not only affects educational achievement; it is affected by constraints of educational attainment and those inflicted because of race. For example, in 2016, median annual earnings of full-time, year-round, workers 25 to 34 years old who had not completed high school were $29,100 for White workers and $21,400 for Black workers.  For those who had completed high school, incomes were nearly $6,000 per year higher: $35,000, for White workers and $27,500 for Black workers.  For those with a Bachelor’s degree or higher, median incomes were $54,700 for White workers and $49,400 for Black workers. Increasing educational attainment narrowed the income gap, but did not close it.  And a smaller percentage of Black Americans attained a college degree than did White Americans: 15 percent compared to 24 percent.

Now for the probable effects of the pandemic on education, especially as it may affect African-Americans, and a look at the likely consequences of those effects.

The National Center for Education Statistics reports that in the school year 2017-2018 the graduation rate for White high school students was 89 percent.  That for Black students was 79 percent, or ten percentage points lower. The 21 percent of Black students who did not graduate from high school may well have had to anticipate spending  their lives in poverty, given that the poverty line is $26,200 and the average income of Black workers without a high school diploma is just $21,400. That, we may have to say, is normal.

Of course, these are not normal times. Most public schools have been closed for the entire second quarter of 2020. What are the implications of that for student learning? Studies of attendance absenteeism show that missing three or more weeks of school diminishes chances for high school graduation and that this begins as early as first grade. Most students in every grade have now missed three months of school, whether or not we call it “absenteeism.”  Those with limited or no access to supplementary (remote) education will have “diminished chances for high school graduation”. We mean youth in grade twelve, youth in grade eight, even children in kindergarten.

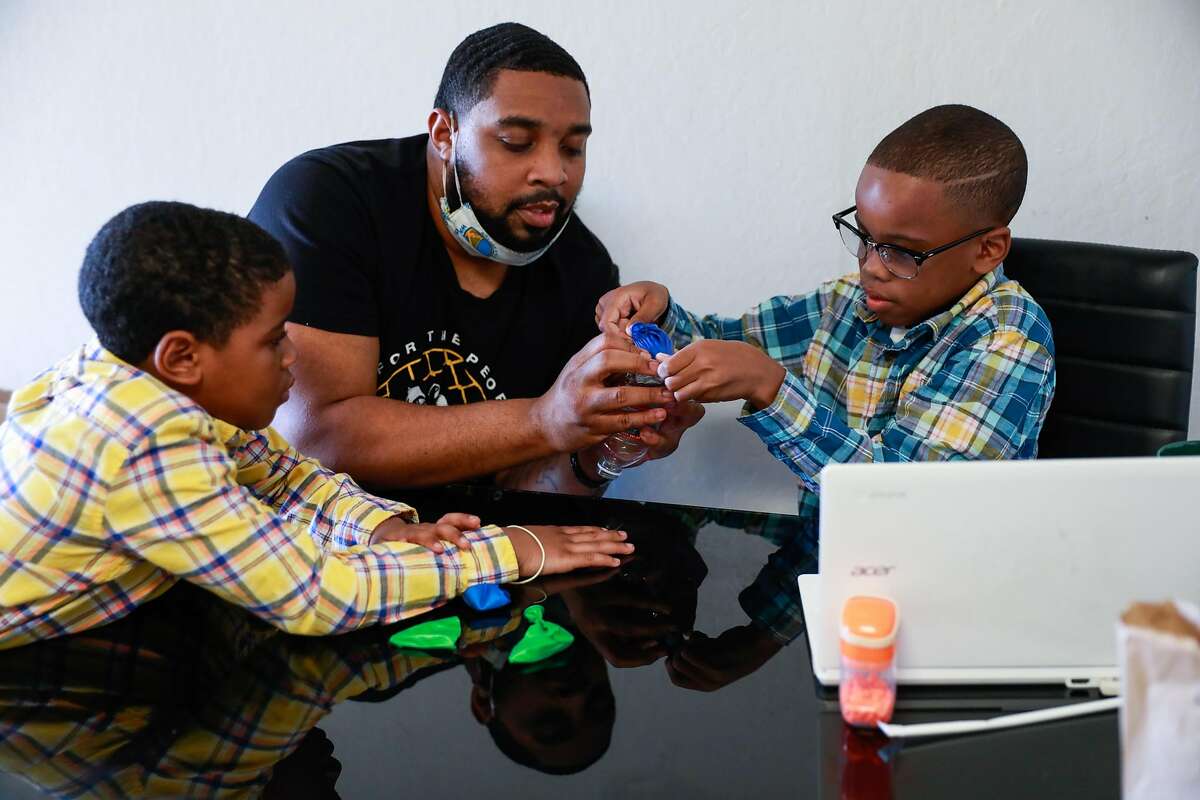
Most public school students have not been to their schools for at least twelve weeks and have been dependent on the Internet for education. Students who normally attend well-resourced schools, whose parents are college-educated and whose homes have access to broadband may have been spending  their days in what might be called enhanced home schooling.  Their schools may have delivered lessons in a variety of ways, including Zoom and the like, and their parents may have served as supplementary educators. Those students may have experienced little or no learning loss.

As might be expected, Internet access varies with household income as well as parental educational attainment.  And by race, of course.  A recent Pew Research Center study found that 79 percent of White homes had broadband access, compared to 66 percent of Black homes. 

Further, more than 90 percent of students in households with incomes over $75,000 and those whose parents were college graduates had broadband access in their homes. [Just a quarter of Black households have incomes over $75,000.] On the other hand, just 46% of homes in which the adults are without a high school diploma have broadband. We can conclude from this that nearly all White students living in middle class or more prosperous households potentially have benefited from schooling available from Internet-based lessons supported by home tutoring, while perhaps half of Black students have not had those advantages. Without broadband access to the Internet and without highly educated parents, students are likely to have simply missed out on schooling. The New York Times reported in April that in some cities between a third and a half of high school students were not logging on for classes.

Thanks to the Trump regime, along with Republican governors as well as well-to-do families clamoring for schools to reopen – even if it endangers low income, Black and Latino families who prefer to stay home- many districts and school systems are even further behind on providing virtual instruction that may be somewhat better than what happened last year.

Black students are the most likely to live in households in or near poverty, least likely to have college educated parents, least likely to have broadband access and most likely to have attended poorly resourced schools. They are particularly likely to incur complete or nearly complete interruptions in their schooling during the pandemic. 

Those families with the means to afford whiteboards and tutor – most of whom aren’t Black or Brown – will manage to escape another education crisis. Many Black and Latino families won’t be able to do that without additional federal and state resources. [Photo by RiShawn Biddle]

The data presented to this point allows for some approximations of the near-term and long-term implications of the pandemic for Black students and their communities. 

We can begin with the 21 percent of Black students who even in the recent rather good year did not graduate from high school.  We might add to those a portion of the 46 percent of Black students who read below the Basic level in grade 8.  Making the generous assumption that the 21 percent who did not graduate from high school are already accounted for among those who had not been taught to read with any facility by middle school gives us an additional 25 percent who under normal circumstances would be at risk of not graduating from high school.  It is not unreasonable to assume that given the pandemic, limited broadband access and the like, these are now as a matter of fact unlikely to graduate from high school. We therefore can work with a rough estimate that half of Black students who were in grade 12 in 2019-20 will not graduate from high school this year.  And the educational attainment of their siblings and other Black students at every grade also will be significantly delayed.

Many schools will, no doubt, make increasingly effective provisions for reaching their students in the 2020-2021 school year.  Educators, like office workers, will become accustomed to performing their tasks remotely, or through a combination of in-person and remote activities.  Student learning loss will gradually return to traditional—unsatisfactory—levels.  But this will not happen all at once and in the meantime large numbers of the most vulnerable students will not receive the level of instruction symbolized by a high school diploma. At best, they will have to repeat a year of school, whether or not that is officially admitted. 

If this is done in parallel with the usual school year, as it probably will if it is done at all, it will require districts to massively increase educational resources, including the number of teachers.  This does not only apply to the k-12 system.  It also applies in the post-secondary world, especially to community colleges, which will find themselves compelled to provide the instruction for their incoming freshman that those students missed due to the pandemic. They may, in effect, become three-year rather than two-year institutions.

We can now put some numbers to this.  If half of the 2020 cohort of Black twelfth graders do not receive meaningful high school diplomas, rather than the fifth that is to be expected in a normal year, then the potential income of each will decline from $27,500 to $21,400. Over a working life of 45 years, this would amount to a lifetime earning loss of $275,000. Given a 2019-20 grade 12 class of approximately 531,000 Black students, this would result in a loss of $73 billion for the Black American community if half do not receive high school diplomas. We can add to this the lost wages of those Black Americans who, for the same reasons, would not have attended and graduated from college.  Call it $80 billion lost to Black America just from the lost wages of what would have been the 2020 graduating class and their peers.

But that is only the beginning.  Learning loss from the pandemic will extend to every school grade: each child in the affected households will lose up to a year of learning opportunities.  Large numbers of those who normally would have achieved at least a high school degree will not complete their educations. And for all of these, the effects will continue within their families as their children grow up in households with parents who are less well-educated than they might have been and their educational attainment, in turn, will be compromised by lower household incomes and a less educationally resourced family.

We know from Raj Chetty’s Opportunity Atlas that the likelihood of Black children in low income households becoming adults with middle or high incomes is minimal.  For those born into low income households in New York City, for example, the Opportunity Atlas projects adult household income at $28,000.  For high income Black households, the corresponding figure is $38,000.  It is much higher for low income White households: $48,000. As a matter of fact, nationally, incomes are higher for White residents born into low income families than those for Black residents born into high income households. That is normal in a racially structured society.

Given pandemic learning loss the number of Black children who will be born into low income families will rise, probably considerably, a condition that that the Opportunity Atlas tells us will in many cases be handed down to their children.  While White children born into low income families, even under these dire conditions, have a good chance of climbing the proverbial ladder out of poverty, Black children have the heavy anchor of racism tied to their legs.  Those begin life in poverty are likely to live their lives in poverty and their children to do so as well.

Given this country’s history and its present situation, one hardly dares recommend what might be done to avoid this dismal future for Black children, for all children in this country whose homes do not have the educational resources to replace those lost to the pandemic.  However, this is America, we can hope, hope that government, at all levels, will act to avoid this catastrophe by both traditional and innovative resourcing of the education system. 

In the short term, universal broadband access for all households with school age children, providing challenging and engaging lessons, utilizing  the possibilities of the Internet for customizing learning. In the longer term, improving pay for teachers and providing career ladders that do not require that they leave the classroom. Rebuilding America’s schools and the buildings they reside in.  Abandoning the model of institutions of higher education as profit-making enterprises. Adapting an attitude for which investments in education at all levels are seen as a public good. Ending racial and gender disparities in the economy.  And so forth. And so forth.

As with Pandora’s box, we are left, at least, with hope.

Comments Off on America’s Genocide Against Black People: Pandemic Edition

New York’s Jim Crow Schools

Wisdom, and knowledge, as well as virtue, diffused generally among the body of the people, being necessary for the preservation of their rights and liberties; and as these depend on…

Wisdom, and knowledge, as well as virtue, diffused generally among the body of the people, being necessary for the preservation of their rights and liberties; and as these depend on spreading the opportunities and advantages of education in the various parts of the country, and among the different orders of the people, it shall be the duty of legislatures and magistrates, in all future periods of this commonwealth, to cherish the interests of literature and the sciences, and all seminaries of them . . . John Adams, Constitution of the Commonwealth of Massachusetts, 1780.

Each year New York City’s elite Stuyvesant High School admits on the basis of the Specialized High School Admissions Test nearly 1,000 ninth grade students, fewer than 10 of whom are Black, about 10 percent from the Black and Hispanic groups combined.  

The SHSAT, essentially a math test, violates a cardinal principle of test design:  It is not aligned with the New York City Mathematics curriculum (or even with the rest of the city’s curricula). Also, no one really passes it because admitting schools determine who can get in without so much as a set cut score, and its purpose since the passage of the Hecht-Calandra Act in 1971 is for discrimination and exclusion, a point previously made on these pages.

However, its annual results are effective in drawing attention to the inequities in the opportunity to learn across the city’s neighborhoods and among its racial and ethnic groups of students.

New York State’s Mathematics Assessment at grade 8, when the SHSAT is given, allocates student performance in four categories:  Levels 1 to 4. It is reasonable to assume that students scoring at Level 4 would be well-qualified for attempting the further hurdle of the specialized high school test if that test were aligned with the curriculum they had studied. Let us assume, for the sake of argument, that was in fact the case.  We can then look at the opportunity available to students in New York City to learn Mathematics to that level. 

The inequitable distribution across the city of opportunities to learn Mathematics, as well as other subjects, is an institutional barrier to educational achievement for many of the city’s children. It would be unacceptable if the quality of water or electricity differed dramatically from neighborhood to neighborhood in New York City.  All the more unacceptable is it that the quality of education provided by the city schools differs, as it does, so dramatically from one neighborhood to the next from one racial or ethnic group to the next.  As John Adams wrote, it is the duty of civic officials to “cherish” education everywhere, not only in certain privileged groups and neighborhoods.

City-wide, 44 percent of Asian students, 29 percent of White students, 10 percent of Hispanic students and only 8 percent of Black/African American students reach Level 4 in Mathematics in grade 8. Why are there those differences in achievement? Is it a matter of cultural differences? That is often suggested, but it is unlikely, as, for one thing, these commonly used racial and ethnic categories are misleadingly homogenized.

If we examine the group most commonly the locus of the cultural difference argument, there are between two and three times as many Chinese as Asian Indian residents of the city; 70,700 Chinese students k-12 compared with 36,000 Asian Indian k-12 students (and only 5,400 Korean children k-12). There are 50,900 Chinese, 24,200 Asian Indian and 12,100 Korean students enrolled in college or graduate school. A third of Chinese adult are without a high school diploma, but only 20 percent of Asian Indian adults are without that minimal qualification and only 8 percent of Korean adults. While just under one-third of Chinese adults in the city have attained a Bachelor’s degree or higher, 44 percent of Asian Indian adults have reached that educational level, as have 55 percent of Korean adults. Median household incomes also vary within the Asian category: from $57,000 for Chinese households, to $68,000 for Korean and $77,000 for Asian Indian households. (The city average is $61,000.)

We therefore find, considering just these three, that “Asian” includes many groups with differing educational needs and resources, varying from the comparatively disadvantaged Chinese residents to the comparatively highly advantaged Asian Indian residents.  No argument about a unified Asian “culture of achievement” seems possible to sustain in the face of these differences.

If not culture, what? For one thing, differences in family resources are well-known to have an effect on individual student educational opportunities. Parental educational attainment strongly affects student achievement in the absence of a public school system fit for purpose.

Just 5 percent of students whose parents did not finish high school reached the “Advanced” level on the grade 8 Mathematics Assessment of the National Assessment of Educational Progress. That’s roughly equivalent to New York Level 4, as did 12 percent of grade 8 students whose parents graduated from college. Household income is another well-known factor affecting student educational achievement in the absence of an equitable public schools system. According to NAEP, only 6 percent of New York grade 8 students who are eligible for the National Lunch program score at the Advanced level in Mathematics; 15 percent of those not eligible, those from more prosperous families, test at the Advanced level in grade 8 Mathematics. (National School Lunch Program eligibility is based on family income.) 

A student eligible for the National Lunch Program, whose parents did not graduate from high school, or whose parents only graduated from high school, is at a compounded disadvantage in relation to a student from a more prosperous family of college graduates.  Why is that?  College educated parents are likely to encourage and expect educational achievement from their children and advocate for high standards of instruction in their children’s schools, provide extra-curricular educational opportunities at home or elsewhere and those with higher incomes can afford other supplementary educational opportunities for their children (including expensive tutoring for the SHSAT). On the basis of parental educational levels and family income Asian Indian and Korean students have an advantage over Chinese students within the Asian category.  This, again, in the absence of a public school system that sets its goal at a standard for all students, not just the fortunate.

“Hispanic,” similarly, is a heterogeneous category, including 700,000 Puerto Ricans and 700,000 Dominicans, 162,000 residents of Mexican origin and many other groups among the 2.5 million Hispanic residents of the city.  Just 18 percent of Hispanic adults in New York City have attained a Bachelor’s degree or higher: fewer in the Puerto Rican and Dominican and Central American groups, only 9 percent among adults of Mexican origin. Median household income for Hispanics is $42,000. 

Black residents of the city are also a varied group.  For example, nearly 200,000 Black residents of New York City are from Jamaica, others from other Latin American countries, still others from Africa. New Yorkers of Jamaican origin have a median household income of $59,490 and a 22 percent rate of college graduation. Overall Black adult education attainment, Bachelor’s degree and higher, is 25 percent and median Black household income is $45,000.

Compare to White, non-Hispanic, educational attainment, Bachelor’s degree and higher, which is 51 percent. Median White household income is $81,000. As with the others, New York’s White, non-Hispanic, population is mixed: 930,000 of White residents are foreign-born:  half from Europe, more than one-third from Latin America.  Forty percent of foreign-born White, non-Hispanic, New Yorkers speak a language other than English in the home.

Poverty rates also contribute to inequities in home and extra-curricular educational opportunities:  20 percent of Asian Indian and Chinese and only 6 percent of Korean children under 18 live in poverty compared with 30 percent of Black and 33 percent of Hispanic children, making it all the more difficult for the families of the latter to compensate for the inadequacies of the public schools their children attend. The home resource education advantage of White, non-Hispanic, children in New York over Hispanic children is 33 percent in educational attainment and $39,000 in median household income, over Black children 26 percent and $36,000. The advantage of Asian Indian children over Black children is close: 19 percent in parental educational attainment and $32,000 in median household income.  Chinese and Korean children also have considerable advantages in household income and adult educational attainment over average Black and Hispanic children. 

There is no need to resort to cultural issues for explanations of the lack of equal educational achievement in New York City.

The argument here is that these city-wide differences in average racial and ethnic family resources should be factored in when calculating the educational resources necessary to achieve equity in opportunity.

The inequities in educational opportunities in New York City are made much worse, because the educational opportunities of students in New York vary by race/ethnicity within, as well as between, neighborhoods. The city has 32 Geographic School Districts across its five boroughs.  The percentages of students taught well enough to reach Level 4 in grade 8 Mathematics varies by district, that is, by neighborhood, from 3 percent to ten times that.  A random student in District 5 could increase the likelihood of reaching Level 4 nearly five-fold through the simple expedient of moving across 122nd Street to District 3.  Or, to put it another way, a given student in Community School District 3 would see her chances of becoming “proficient” in Mathematics reduced from 14 percent to 3 percent if she happened to move a block into District 3. This situation is by no means unique to Districts 3 and 5.  There are even more dramatic examples elsewhere in the city.

Neighborhood school district results by race and ethnicity show wide variations from the city-wide averages. Considered by district, Asian Level 4 Mathematics percentages range from 10 percent to 57 percent; White student Proficiency percentages range from 5 percent to 55 percent; Hispanics from 2 percent to 19 percent and Black Level 4 Proficiency percentages range among districts from 1 percent to 15 percent.  There is, then, an overlap in the 10 percent-15 percent range of outcomes for all students. In other words, it appears that student performance changes with variations in the opportunity to learn provided by the schools in their district, exacerbated by racial and ethnic variations in such factors as parental income and educational attainment.  For example, a Black student in Districts 20 or 17 has a better chance of being taught Mathematics to Level 4 than an Asian student in District 27.  A Hispanic student in District 21 has a better chance of being taught Mathematics to Level 4 than a White, non-Hispanic student in District 13.  Some of New York’s neighborhood Districts provide better instruction to all students, without regard to race, ethnicity and parental factors.  Others provide inadequate opportunities to learn for all their students. Most Black and Hispanic students are in those districts.

Furthermore, even if there were equal provision of education resources in the schools, Asian Indian students in New York City would have a large advantage based on parental education level alone and an additional advantage based on their relatively high median household income, followed by White, Korean and Chinese students, in this manner having a wider range of opportunities than Hispanic and Black students.  This appears to be borne out based on New York State Mathematics tests and the SHSAT results.

It is invidious to shrug and attribute student education outcomes to what has been called “pre-conception I.Q.,” the ability to choose wealthy or highly educated parents.  It is the duty of the schools to ensure that the outcomes of education are not simply an artifact of where students began.  And it is the duty of “magistrates and legislatures” to allocate resources where they are needed in order to support educators in that endeavor, not least because, especially today, “Wisdom, and knowledge, as well as virtue, diffused generally among the body of the people [are] necessary for the preservation of their rights and liberties.”

Comments Off on New York’s Jim Crow Schools

L.A. Unified’s Mathematical Apartheid

Based simply on how it miseducates Black and Latino children, the Los Angeles Unified School District, the second largest school district in America, is even more racist in its outcomes…

Based simply on how it miseducates Black and Latino children, the Los Angeles Unified School District, the second largest school district in America, is even more racist in its outcomes than the larger and notoriously racist New York City public schools. Dropout Nation readers, who have read numerous pieces here about the district, have long ago known this. But the crisis bears repeating over and over again.

As mathematics is increasingly important for employment and participation in society, we can take the extent to which L.A. Unified is successful—or not—teaching mathematics as a meaningful indicator of its success as an educational institution. We can look at whether it is successful in educating all the children in its care.

First, some context.  Los Angeles, the city, has roughly the same number of residents reporting themselves to the Census as “White alone” as “Hispanic” at two million each, nearly half a million reporting as “Asian,” and not quite 400,000 reporting as “Black or African American.” [The surrounding communities also served by L.A. Unified differ little demographically from L.A. itself.] These proportions are quite different from those of the nation, with 236 million “White alone,” 41.4 million “Black or African American,” 58.8 million “Hispanic,” and 18 million “Asian alone.”

Los Angeles is less White, more Hispanic, less Black and more Asian that the United States in general. However, as with the rest of the nation, White, non-Hispanic, and Asian residents of the city have higher incomes and higher levels of educational attainment—factors increasingly tightly linked—than its Hispanic and Black residents. It is not too much to say that it is because the city’s White, non-Hispanic, and Asian residents have higher levels of educational attainment that they have higher incomes.

The National Assessment of Educational Progress measures Mathematics, Reading and other subjects at grades 4, 8, and 12.  The assessments at grade 8 are useful as indicators of the quality of education provided by districts and states as by then students have been in school for most of their lives and there is little change in achievement levels afterwards. People who were strong in mathematics in middle school are likely to be strong in math in later grades; people who did not do well with math in middle school are unlikely to become mathematically literate in later life.

NAEP allows analysis for racial/ethnic groups and eligibility for free or reduced-price meals—a measure of income—among other factors.  In 2017, nationally, a quarter of White, non-Hispanic, students in grade 8, qualifying for free or reduced price meals (that is, relatively poor) scored at or above Proficient on the Mathematics assessment, while more than half of White, non-Hispanic students, who were from families with incomes too high to qualify, scored at the Proficient or Above levels.  Just over a third of the poorer White, non-Hispanic, students and 14 percent of the more prosperous White, non-Hispanic, students were reported as scoring “Below Basic,” that is, they could not do middle school mathematics.  In other words, most White, non-Hispanic, students, and the great majority of those from middle class families, could do some middle school mathematics.

The latter higher income group of students, as you would expect, often can count on help from other sources: parents, tutors, private after-school classes and all around better resourced schools. These family resources may be taken as totaling an amount equal to at least an additional one-third to one-half of the public investment for each child, while the public resources—the greater funding of suburban schools—in many places double the investment in the education of less privileged children.

On the other hand, NAEP finds that nearly 60 percent of Black and 48 percent of Hispanic students whose families have incomes low enough to qualify for the National School Lunch Program in eighth grade score at the Below basic level on the Mathematics assessment.  Most poor Asian and White students learn at least some middle school mathematics; half of Hispanic and most Black students do not.

That is the national picture.

This racial gap is much worse in Los Angeles with its extreme income inequalities. A demographic map of Los Angeles would hardly show more strictly defined concentrations of racial and ethnic groups if segregation were legally enforced. The center of the urban area is nearly exclusively Black. The arc of the area, from Pasadena to Malibu, White, non-Hispanic, and the remainder Hispanic apart from two or three Asian areas.

This sociopolitical segregation is also economic segregation. For example, Watts, the classic Black neighborhood of the city, has a median household income of $25,000 per year. Average household incomes in the predominately White, non-Hispanic, areas to the north and west begin at $60,000 and rise rapidly through the $100,000s.

Even if you disagree with UTLA’s demands to kibosh charter schools, you also have to agree with the AFT local’s point that L.A. Unified engages in educational apartheid. [Photo courtesy of LAist.]

The Opportunity Atlas of Raj Chetty’s group at Harvard shows that a Black child born into what passes for a middle income family in the South Figueroa area can look forward to living as an adult in a household with an income of $20,000 a year.  A White child in, say, the not particularly wealthy Baldwin Hills area, $65,000.

In general, White, non-Hispanic, and Asian households in Los Angeles have above average incomes, Black and Hispanic households have below average incomes. Consequently, there are not enough White, non-Hispanic, and Asian middle school students eligible for the National Lunch Program in LAUSD for NAEP to legally count. And there are not enough Black middle school students who are not eligible for the National Lunch Program for NAEP to count.  Only Hispanic students are represented on both sides of the income divide.

These racial, ethnic and economic divisions in the city are reflected in educational outcomes. More than half—55 percent—of poor Hispanic students in Los Angeles have not learned mathematics at grade level by middle school.  Catastrophically, nearly three-quarters (72 percent) of the district’s Black students have not learned mathematics at grade level by middle school and just six percent score at or above NAEP’s “Proficient” level. On the other hand, over half of White, non-Hispanic, and Asian LAUSD middle school students learn mathematics at or above grade level and only 13 percent do not. 

Per pupil public expenditure in L.A. Unified is approximately $12,000. If we take the middle-class family-funded educational “supplement” of after-school, weekend and summer classes and other educational activities as a minimum of one-third of that, we arrive at a $16,000 public/private investment in middle class students. At 50 percent it is $18,000, an enough explanation for the racial gap in middle school mathematics achievement in the district.

Closing that gap within the district itself would require, minimally, the allocation of public funds on the same scale to schools serving impoverished Los Angeles students.  Those would go to supporting enhanced early childhood education, after-school, weekend and summer classes, more teachers and teacher training, more support personnel, smaller class sizes. These measures are substantially the unprecedented (and more-laudable) demands made by United Teachers of Los Angeles, the American Federation of Teachers local, in its strike last year.

It is remarkable that the management of the district opposed those proposals, and pitiful that victory resulted in such grudging, minimal, changes. 

Comments Off on L.A. Unified’s Mathematical Apartheid

Low Country for Black Children

Beyond the presence of former Gov. Nikki Haley and the BMW plant in Spartanburg, South Carolina has always been an unusual state. Yet its racial caste system – and how…

Beyond the presence of former Gov. Nikki Haley and the BMW plant in Spartanburg, South Carolina has always been an unusual state. Yet its racial caste system – and how it keeps Black children from gaining high-quality education – makes it as normal as Wisconsin and Mississippi.

After Europeans arrived, they settled it with enslaved people from the rice growing regions of West Africa, who used their traditional knowledge and skills to turn the Low Country into a major source of food and indigo for the first British Empire. The slave owners, who seldom visited the malarial plantations along the coast, grew rich. The slaves, who survived, remained slaves. Away from the coast, the Piedmont foothills of the Blue Ridge Mountains were settled by Scotch-Irish migrants working their way down the Appalachian Mountains.

This immigration pattern can still be seen today in the demographics of the state. The western-most counties are nearly entirely White. Though the coastal counties are now populated by White immigrants from outside the state, the Low Country is still mostly-Black.  

At the beginning of the twentieth century most farms in the center of the state were worked by tenants and sharecroppers, many of whom were White, but most of whom were Black, and they were still the majority of the state’s population. The textile and tobacco factories that were becoming common were the scenes of union organizing alternating with violent strikebreaking against the impoverished workers, Black and White, men and women.

Fitting for the place where Denmark Vesey and others were executed for leading a slave revolt at the beginning of the 19th century, Jim Crow was particularly severe in South Carolina. The Black population disenfranchised, allowed only minimal education. J. E. Swearingen, then the state’s Superintendent of Education, wrote in his 1915 Annual Report: “The Negro . . . cannot remain ignorant without injury to himself, his white neighbors, and to the commonwealth.  [On the other hand, h]is training should fit him to do the work that is open to him.” That year, according to researcher Elspeth Smith-Stuckey, more than 90 percent of the segregated schools for Black children had only one teacher. In 1920, Superintendent Swearingen’s “reform” budget asked for $5 per Black student and $$25 per White student.

The Great Migration saw much of the Black population of the state move north, leaving more than one million descendants of enslaved Africans now living in the state continuing to suffer from the heritages of slavery and Jim Crow. Today, Black South Carolina residents are concentrated, not in the Low Country, but in a band across the middle of the state from Allendale to Marion counties, where they form more than half the population. These counties are among those in the state with the lowest per capita income and the lowest percentage of college graduates.

The Scotts Branch High School in Summerville, S.C., stands as one example of how the Palmetto State worked diligently to avoid segregation. [Photo courtesy of the Post & Courier.]

There is little inter-generational income mobility in South Carolina.  Nowhere in the state are a child’s chances of reaching the top fifth of the national income distribution, given parents with incomes in the bottom fifth, greater than 5 percent.  That is the average for all state residents.

It is much worse for South Carolina’s African-American residents. The Opportunity Atlas produced by Raj Chetty’s group, now at Harvard, tells us that Black children born in low-income families in Charleston County, on the South Carolina coast, as adults, on average have incomes of $24,000 (less than half the national figure), an incarceration rate of 5.6 percent, a high school graduation rate of 73 percent and a college graduation rate of 17 percent. The average Black student in the Charleston schools attends a school where two-thirds of the students are from poor families, while the average White student attends a school where just 42 percent. of the students are poor.

White adults, who as children were born into low-income families in Charleston County, on average have incomes of $35,000, an incarceration rate of 1.8 percent, a high school graduation rate of 81 percent and a college graduation rate of 24 percent. In other words, there is a $11,000 penalty for being born Black in Charleston County.

In this comparatively wealthy part of South Carolina, the chances for inter-generational upward mobility are practically inexistent for Black children.

In majority-Black Allendale County, three counties up-state from Charleston, Black children born in low-income families, as adults, on average have incomes even less than those in Charleston, $21,000, incarceration rates of 2.5 percent, a high school graduation rate of 70 percent and a college graduation rate of 19 percent, while their White peers, with the same high school graduation rate and a lower college graduation rate (15 percent), have household incomes of $32,000 and an incarceration rate of less than 1 percent.

The penalty for being born Black in Allendale County, as in Charleston County, is $11,000 less in income and twice the chance of incarceration.

The chances are similar for inter-generational mobility for those born into high-income households.  In Allendale County, a White child born into a high-income family can look forward to a household income of $54,000—$12,000 more than a White child born into a low-income family in the county.  A Black child born into a high-income family in Allendale County can look forward to achieving a household income of $29,000—$8,000 more than a Black child born into a low-income family in the county, but $3,000 less than a White child born into a low-income family in the county.

In Charleston County, a White child born into a high-income family can look forward to a household income of $52,000—$17,000 more than a White child born into a low-income family in the county.  A Black child born into a high-income family in Charleston County can achieve, on average, a household income of $36,000—$15,000 more than a Black child born into a low-income family in the county, but only $1,000 more than a White child born into a low-income family.

In spite of the comparatively low rates of White college graduation in Allendale and similar counties, state-wide, the percentage of White college graduates is more than double that of Black college graduates. More of the state’s Black residents have not finished high school (18 percent) than have graduated from college (15 percent). This has a direct effect on family and household income, as college graduates are paid more than twice what workers of the same race with less than a high school diploma are paid and those with a doctoral degree are paid three times as much as those of the same race with less than a high school diploma.

The days of the Rosenwald schools such as this one in St. George, S.C., may be behind us. But the reality of educational inequality, the legacy of slavery and Jim Crow, remains alive.

Black households South Carolina are poorer than White residents of the state and poorer than the national average for Black households. This is to be expected. It’s the legacy of White people brutally enslaving and oppressing enslaved Africans, especially after the execution of Denmark Vesey, the founder of Mother Emanuel A.M.E. Church, and others for allegedly plotting a slave revolt.

Sixteen percent of Black families in South Carolina somehow live on incomes of less than $10,000 a year, nearly three times the percentage of similarly deprived White households.  The national median White household income is $63,700, for Black households it is $40,200.  In South Carolina it is $58,500 for White households and only $32,200 for Black households. The median Black family income is just over half that of White, non-Hispanic, families. In South Carolina, more than four times the percentage of White households as Black households have incomes over $200,000 per year: 4 percent compared to less than 1 percent. More than twice the national average percentage for all Americans, 42 percent, of South Carolina’s African-American households are in the bottom fifth of the national income distribution and only 7 percent have incomes in the top 20 percent of the national income distribution.

Nearly forty percent of school-age Black children in South Carolina live in poverty. Unless there is a change in the state’s education system, things will stay that way.

The National Institute for Early Education Research ranks South Carolina as 11th among the states for access to pre-school enrolling 41 percent of its 4-year-olds in state supported pre-kindergarten programs. But it ranks only 38th for resources provided to pre-kindergartens. High quality early childhood education programs have been shown to have positive effects on primary school learning.  However, in South Carolina, with its deficient funding of prekindergarten, and below average K-12 per student expenditures, by fourth grade nearly two-thirds of African-American students in the state’s public schools are assessed by the National Assessment of Educational Progress (NAEP) as functionally illiterate (“below basic”) and just 15 percent have the expected reading skills for that grade. The comparable percentages for the state’s White students are reversed: 40 percent reading proficiently and less than a third with skills that are judged as below basic. 

The educational opportunities in the primary grades in South Carolina are clearly differentiated by race. As reported by NAEP, the state’s White fourth-graders, whether from lower- or middle-income families, read at the national averages for each of those groups. Black fourth-graders from lower-income families, that is, most Black families, have lower achievement levels than the national average for lower-income Black children. The state’s Black-White gap for lower-income student is 19 percentage points in favor of White students among those students reading at grade level. Although fourth-graders from the state’s relatively small number of middle-income Black families have higher achievement levels than the national average for their group.  Among middle-income students the gap is a virtually identical 20 percentage points in favor of White students at the proficient level.

Black students in South Carolina are twice as likely as White students to be functionally illiterate in fourth grade and are only a third as likely to be taught to read proficiently.

By eighth grade, the percentage (48 percent) of South Carolina’s Black students who are functionally illiterate has declined slightly from the percentage at fourth grade, but so has the percentage (11 percent) reading at grade level.  The White-Black gap is 30 percentage points among proficient readers and the Black-White gap is also 30 percentage points among those assessed as reading below basic, both gaps having widened after four years of schooling. More than half of the state’s Black students from lower-income families are functionally illiterate at grade eight, as are nearly a third of Black students from middle-income families. 

While 22 percent of Black students from middle-income families read at grade level, only a negligible 8 percent of those Black students from lower-income families have been taught by the South Carolina schools to be proficient readers. A White, non-Hispanic, student from a lower-income family is more likely to read proficiently than a Black student from a middle-income family and less likely to have been left functionally illiterate by their school. Having college-educated parents gives White students in South Carolina a 33 percentage point advantage over those with parents without a high school diploma, but the gap between Black students with college-educated parents and those with only a high school education is just 7 percentage points. A White student whose parents did not finish high school is more likely to be taught by their school to read proficiently than a Black child of college graduates.

Negative school effects in South Carolina overwhelm family education levels for Black children.

South Carolina schools such as Spring Valley High, where a homeless student whose mother had died was manhandled and arrested by a school cop over a minor incident, overuse both harsh school discipline and juvenile courts.

South Carolina fails to educate both Black and White children to the national averages for those groups, White children only marginally less, Black children very much less well. While nationally, in 2017, 18 percent of Black children in grade 8 read “proficiently” or above according to NAEP, in South Carolina just 11 percent achieved that level.  There has been some progress in the reading levels of Black children nationally; there has been none for Black children in South Carolina.

One explanation for these differences in educational opportunities might be found in the historic and continuing racial segregation of the schools in South Carolina.  According to data from Brown University’s US Schools index, in the Charleston metropolitan area, for example, where half the students are White and over one-third are Black, a White elementary school student is likely to be in a school where two-thirds of the other students are White, while a Black elementary student will be in a school that where over half the other students are Black. Due to persistent segregation the average Black student will be in a school that is 62 percent poor, regardless of the income level of that student’s own family.

Another factor restricting educational opportunities is school discipline practices.  The latest year for which state-level school discipline data is available from the U.S. Department of Education’s Office for Civil Rights is 2013-14. That year, 35 percent of students in South Carolina were Black and 53 percent White, but 61 percent of students given at least one out-of-school suspension were Black as compared to 31 percent who were White. Research has shown that school discipline rates are in large part determined by racial attitudes of teachers and administrators. Higher rates of out-of-school suspensions and expulsions are associated with repeated grades and failure to graduate from high school.

The educational opportunities available in South Carolina’s schools culminate with (or without) high school graduation.  According to the South Carolina state “report card,” the 4-year adjusted cohort graduation rate reported by South Carolina for the 2016-17 school year was 83 percent for Black students and 86 percent for White students. However, the percentage of students meeting the ACT College-Ready Benchmark in English was only 17 percent for Black students (and 53 percent for White students). Just half of African-American students in South Carolina who took the SAT in 2018 met the College Board’s College and Career Readiness Benchmark in English, compared to 86 percent of White students.  Half of Black SAT test takers met neither the English nor the Math Benchmark, as compared to just 12 percent of White South Carolina test-takers. If a South Carolina high school diploma were meaningful, this would give a graduation rate of just over 40 percent, rather than 83 percent, for Black students.

South Carolina no longer has legally segregated schools, but its schools remain largely segregated by race and doubly so by income.  The result is that although nearly a quarter of Black students from middle-income families in the state are taught to read at the expected level in middle school, fewer than a tenth of Black students from lower-income families are taught to read proficiently and half are left functionally illiterate.  Even those Black students from middle-income families are only half as likely to be taught to read proficiently as are their White peers and nearly a third of them are left functionally illiterate.  The consequences can be seen in the Bureau of the Census’s economic and educational attainment data for the state given above.  South Carolina’s Black citizens remain in the situation defined for them by the Founder’s at three-fifths of that of their White neighbors.

Comments Off on Low Country for Black Children

What Scott Walker Hath Wrought

Generally speaking, the largest group of least advantaged children in the United States, those most in need of protection, are the impoverished descendants of enslaved Africans. We might then ask,…

Generally speaking, the largest group of least advantaged children in the United States, those most in need of protection, are the impoverished descendants of enslaved Africans. We might then ask, when directing our attention to Milwaukee, the largest city in the once progressive state of Wisconsin – and part of the home base of now-politically endangered Gov. Scott Walker – what has come of that duty of care?

The latest release of findings from the National Assessment of Educational Progress, the “gold standard” for such matters, shows that nationally 13 percent of Black students eligible for the National Lunch Program—a good enough proxy for poverty—read at or above grade level in  eighth grade.  This is half the percentage of White, non-Hispanic, students at a similar family income level and a quarter of the percentage of White, non-Hispanic students from more prosperous households.  Less than a third of Black students from families with incomes high enough to make them ineligible for the National Lunch Program read at or above grade level in grade 8.  The issue appears to be the layering of economic deprivation over racial discrimination in educational opportunities: multi-generational economic deprivation as a consequence of continuing racial discrimination.

In Milwaukee there are considerably higher percentages of Black K-12 than White K-12 students in the city’s schools.  There are more than twice the percentage of White than Black college students (and three times the percentage of White male (44 percent) than male Black college students (14 percent)) These distributions are considerably different from national figures, which show approximately equal Black and White enrollment at every level.  Just over a quarter of White residents of Milwaukee have only high school diplomas (including equivalents), as do considerably more, just over a third, of Black residents.  On the other hand, 34 percent of White residents have a Bachelor’s degree or higher, but only 13 percent of Black residents have that increasingly necessary qualification.

In a nutshell college graduation is achievable for a third of White residents of Milwaukee, but for only just over a tenth of Black residents of the city. This is unusual. Nationally, although the figure is the same for White, non-Hispanics, it is nearly twice as high as the comparable Milwaukee figure for African-Americans (20 percent?).

Just five percent of Black students in Milwaukee eligible for the National Lunch Program read at or above grade level in  eighth grade. More than half—nearly two-thirds—of these economically deprived Black students in Milwaukee are assessed as being at the “below Basic” level.  They can’t read middle school material.  Five percent is meaningful beyond its comparative value. It points to chance factors predominating in measurement:  students answering questions at random and getting lucky; transfer students from Ghana; children of university faculty; cosmic rays.

For all reasonable intents and purposes the Milwaukee public schools are not teaching Black students to read.

The percentage of Black students in Milwaukee eligible for the National Lunch Program scoring at or above “proficient” in Mathematics in eighth grade is 3 percent. Cosmic rays as a causal factor for this achievement seems most likely.

The Milwaukee public schools are not teaching math to their Black students.

In Milwaukee, African-Americans go to school, but they rarely receive a good enough education so that they can read proficiently or perform elementary mathematics tasks or to take them into and through college. It is not then surprising that the unemployment rate for Black residents of the city is between two and three times that of White residents, that the percentage of Black residents of the city in white collar jobs is half that of White residents, that median Black household income is half that of White household income and that the poverty rate for Black families is nearly three times that for White families.

These issues are so common as to seem abstract, or to be accepted, like the weather.  But like the weather, or, rather, the climate, they are not either abstract or acceptable.  The condition of the descendants of enslaved Africans now living in Milwaukee is directly attributable to the decisions of politicians at the state and local level.  Those decisions have reduced funding for the public schools, segregated housing and employment opportunities, criminalized daily life.

All of this brings us back to Gov. Walker, who is likely to lose his post this November (though, as he has proven in elections past, you can never fully count him out).

He has been governor of Wisconsin since 2011.  Before that he was Milwaukee County executive and before that he represented a district in Milwaukee County.  He has been responsible for the well-being of residents of Milwaukee, its surrounding area and the state for a quarter of a century. If residents of Milwaukee seek a monument for him, they have only to look around them.

Comments Off on What Scott Walker Hath Wrought

D.C.’s School Problem for Black Kids

Certainly Washington, D.C., is at the center of a rapidly growing metropolitan area. But the Nation’s Capital is itself a relatively small city. Just 680,000 live within the heart of…

Certainly Washington, D.C., is at the center of a rapidly growing metropolitan area. But the Nation’s Capital is itself a relatively small city. Just 680,000 live within the heart of the Beltway, of whom approximately 320,000 are Black and 280,000 are White. Or, to be clearer, it is two cities, one White and increasingly prosperous, the other Black.

Black Washington is not in any meaningful way in the same socio-economic category as White Washington, and that is clear by every economic and educational measure. Which makes all the discussions about D.C. Public Schools’ graduation fraud scandal even more important than it already appears.

While the unemployment rate for White Washington is just 1.5 percent—hardly measurable—that for the Black population is nearly nine times higher: 13 percent. The White unemployment rate has slightly decreased since the 2007 financial crisis; the Black unemployment rate has increased by three percent, a difference that is itself twice the current total White unemployment rate.

Eighty percent of the employed adult White civilian population work in middle class occupations: in management, business, science and the arts.  Just eight percent are employed in service occupations. In contrast, less than 40 percent of the employed adult Black civilian population work in middle class management, business, science and arts occupations, while a quarter of employed adult Black civilians work in service occupations.  White residents of the District are managers; many Black workers serve them in one way or another.

In Washington, D.C., nearly 90 percent of the District’s White residents have Bachelor’s or Graduate degrees, qualifications attained by just a quarter of Black residents 25 years of age and over.

As a result, the median household income for White residents of the District was $126,000 in 2015; the median household income for Black residents less than a third of that, $38,000.  (By way of comparison, the median household income for the United Stats is $55,000.  Nearly two-thirds of American households have incomes over the District median for Black households.) The poverty rate for White families in Washington, D.C., like the unemployment rate, is vanishingly small, just 1.4 percent, while nearly a quarter of Black families, 23 percent, are poor. 18 percent of Black households have incomes of less than $10,000; 26 percent of White households have incomes over $200,000.

The DC Fiscal Policy Institute has found that Washington’s White families have 81 times more wealth, on average, than Black families, and “a higher level of income inequality than any state in the country, with households in the top 20 percent of income having 29 times more income than the bottom 20 percent.  The bottom fifth of DC households had just two percent of total DC income in 2016, while the top fifth had a staggering 56 percent.” The Institute concludes that “race is at the heart of DC’s economic inequality.”

Poverty, like wealth, can be inherited.  According to the Equality of Opportunity Project at Stanford University, a Black child born to Washington, D.C. area parents with incomes in the 25th (bottom) percentile, as an adult, is likely, on average, to have an income at the 32nd percentile, only 7 points higher, while a White child born to parents with incomes at the 25th (bottom) percentile, as an adult, is likely, on average, to have an income at the 43rd percentile, 18 points higher. The upward mobility chances of one of the few White children born into poverty in Washington are between two and three times those of one of the many Black children born into poverty in the city.

Wealth, like poverty, tends to be inherited.  This often comes from home ownership.  In Washington, D.C., due to, among other things, mid-twentieth-century federal policies, approximately half of the White population own their own homes, while only a third of the Black populations own their homes. The median value of those White owner-occupied houses is $739,000; that of Black owner-occupied units is $385,000. If these houses are passed along to the next generation, the children of White homeowners start with twice the wealth, from this source alone, as do the children of Black homeowners.

Certainly D.C. Public Schools is no longer the Superfund Site of American public education. But it still has miles to go before it can receive applause for properly education Black children.

In the nation’s capitol, the caste system that replaced slavery is characterized by a wealthy White, managerial caste and an impoverished, Black, service caste, with the former averaging incomes in the top 10 percent of the national income distribution, the latter averaging incomes far below that.  Black children born into poverty have less of a chance of rising out of poverty than White children; the relatively few Black children of upper middle class parents have a greater chance of falling to a lower class than their White peers.

In addition to inherited wealth, largely unavailable to Black residents of Washington, education is a proven route out of poverty. But this route is also closed to Washington’s Black children — often regardless of whether they attend a traditional district or charter school.

The average Black student attends a school in which 82 percent of the students are poor; the average White student attends a school in which only a quarter of the students are from poor families. The Brown University Dissimilarity Index measures whether one particular group is distributed across census tracts in the metropolitan area in the same way as another group. A high value indicates that the two groups tend to live in different tracts. A value of 60 (or above) is considered very high. The Black-White Dissimilarity Index for the District is 83 out of 100.

Before the Supreme Court’s Brown decision, Washington had some fine schools for Black children. Segregation does not automatically lead to differentiated education achievement; after all, children in public charters schools generally do better than their peers in traditional districts despite stratification based on race. It’s just that the reality in traditional public schools is that segregation usually leads to worse outcomes for Black and other minority children.

In D.C.’s schools, 79 percent of fourth-grade White students whose family income is sufficient  to make them ineligible for the National Lunch program, test as Proficient or Above in reading (and 95 percent Basic or Above).  For all intents and purposes, all the district’s middle class White fourth grade students are taught to read at an acceptable level or beyond that: very well.  And the White students who are not from middle class families? There are too few White students eligible for the National Lunch Program in Washington for NAEP to report their test results.

Over 90 percent of public school students in the Washington, D.C. are eligible for free or reduced-price lunch.  Almost all of these are Black. Educational opportunity in the District of Columbia’s traditional district (as well to a lesser extent, in its charters) are distributed by race and income.  It amounts to the same thing.

In fourth grade, 44 percent of the few Black students whose family income is sufficient  to make them ineligible for the National Lunch program test as Proficient or Above in reading (and 80 percent Basic or Above). Just 15 percent of Black fourth-graders whose family income is low enough to make them eligible for the National Lunch program test at Proficient or Above in reading (and 44 percent Basic or Above).

Then in eighth grade, 82 percent of White students, nearly all of whom are ineligible for the National Lunch program, test at Proficient or Above in reading (and 96 percent Basic or Above). Just over a quarter, 27 percent, of Black eighth-grade students whose family income is sufficient  to make them ineligible for the National Lunch program test as Proficient or Above in reading (and 69 percent Basic or Above).  But only seven percent of Black students whose family income is low enough to make them eligible for the National Lunch program test at Proficient or Above in reading (and 39 percent Basic or Above).

These numbers matter.  Literacy is essential for all other education; reading skills rarely change much between middle school and high school graduation (of which more below).

Between grades 4 and 8, the percentage of the relatively few middle class Black students in Washington testing above Basic in reading declined from 80 to 69 percent; the percentage of the much larger number of Black students eligible for the National Lunch Program testing at or above Basic in reading declines from 44 to 39 percent. Between fourth- and eighth grades, the percentage of the relatively few middle class Black students in Washington testing at or above Proficient declines from 44 to 27 percent; the percentage of the much larger number of Black students eligible for the National Lunch Program testing above Proficient declines from 15 to 7 percent. More time in the District’s schools results in lower rates of educational achievement for Black students.

The educational background of the parents of White students is not apparent in test results. Eighty-five percent of White eighth-graders whose parents graduated from college test as Proficient or Above in reading (and 97 percent Basic or Above).  On the other hand, the children of highly educated Black parents actually do worst than other middle class Black children, with just 15 percent of Black eighth-graders with some form of higher education scoring Proficient or Above in reading (and 52 percent Basic or Above).  The children of less well-educated Black parents do worse yet: just six percent of Black students whose parents only graduated from high school test at Proficient or Above in reading (and 34 percent at Basic or Above).

The District of Columbia school system claimed a 73 percent graduation rate in 2017. The Washington Post recently reported that “one in three graduates received their diplomas in violation of city policy. Wrote the Post:  “Those students had walked across graduation stages despite missing too many classes or improperly taking makeup classes. . . Even if all of the students regarded as “moderately off-track” receive diplomas, the graduation rate would stand at about 61 percent — 12 points below last year’s.”

Would even 61 percent of Washington, D.C. students graduate college and career ready? Not at all. In eighth grade, just 53 percent tested at or above Basic in reading, just 25 percent were Proficient or above. It is probably significant that in 2013 96 percent of students entering the Community College of the University of District Columbia required at least one remedial course; half needed remediation in four subjects. By 2017 it was reported that 98 percent of public school graduates needed remediation after enrolling in the University of District Columbia.

Given this education system, Washington, D.C., will likely remain two cities, one White and increasingly prosperous, the other Black, impoverished, in a context in which poverty is reproduced from one generation to the next. Simply allowing children incapable of succeeding in college and life to graduate isn’t going to help end this racial caste system.

Here’s a suggestion for the District of Columbia Public Schools:  Instead of faking graduation rates, teach your Black students to read.

Comments Off on D.C.’s School Problem for Black Kids

We Need Oscar Micheauxs for School Reform

Type on the field below and hit Enter/Return to search